Research Experience
Our ten years of data analysis service – means that hundreds of tabulations, tens of thousands data-checks, millions of numbers have passed through us. Our prior experience of “classic” market research gives us a profound insight in the needs of a PM regarding data.

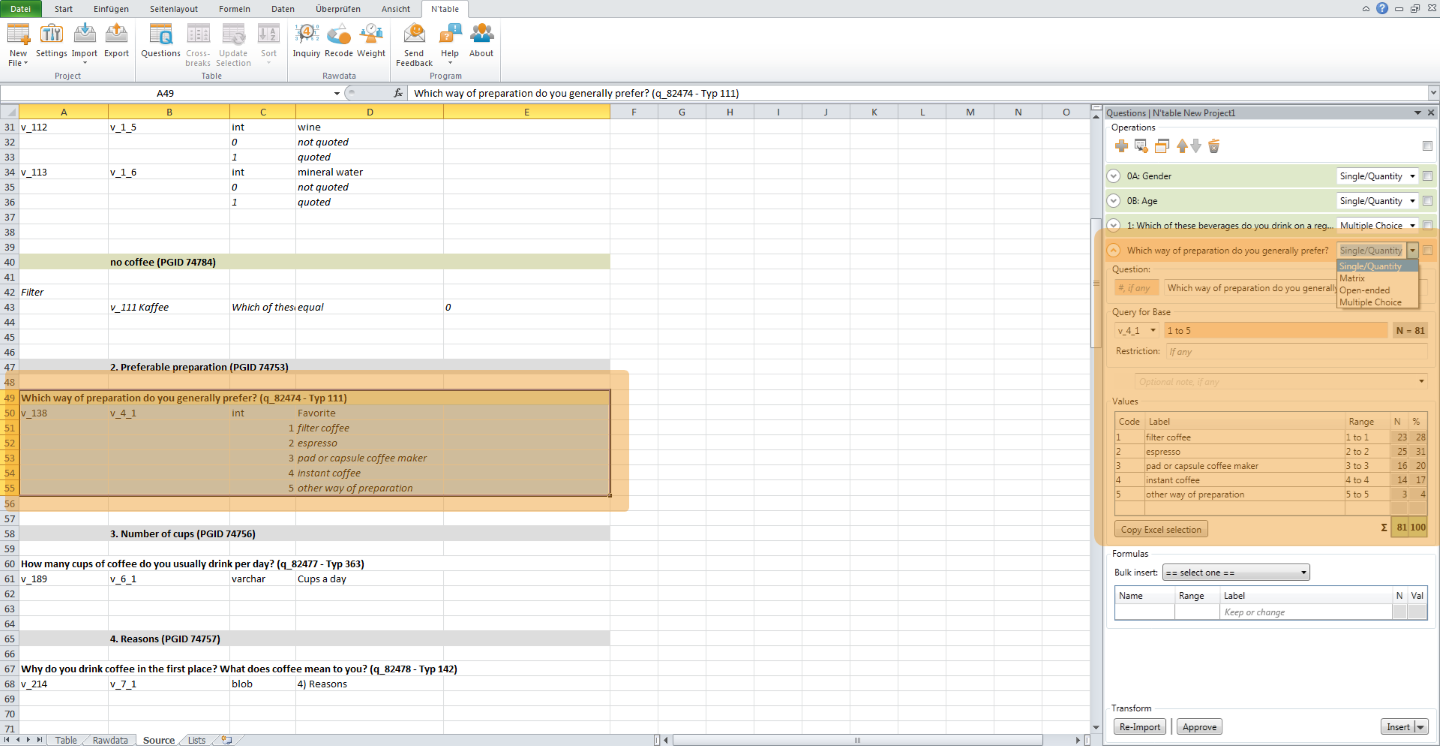
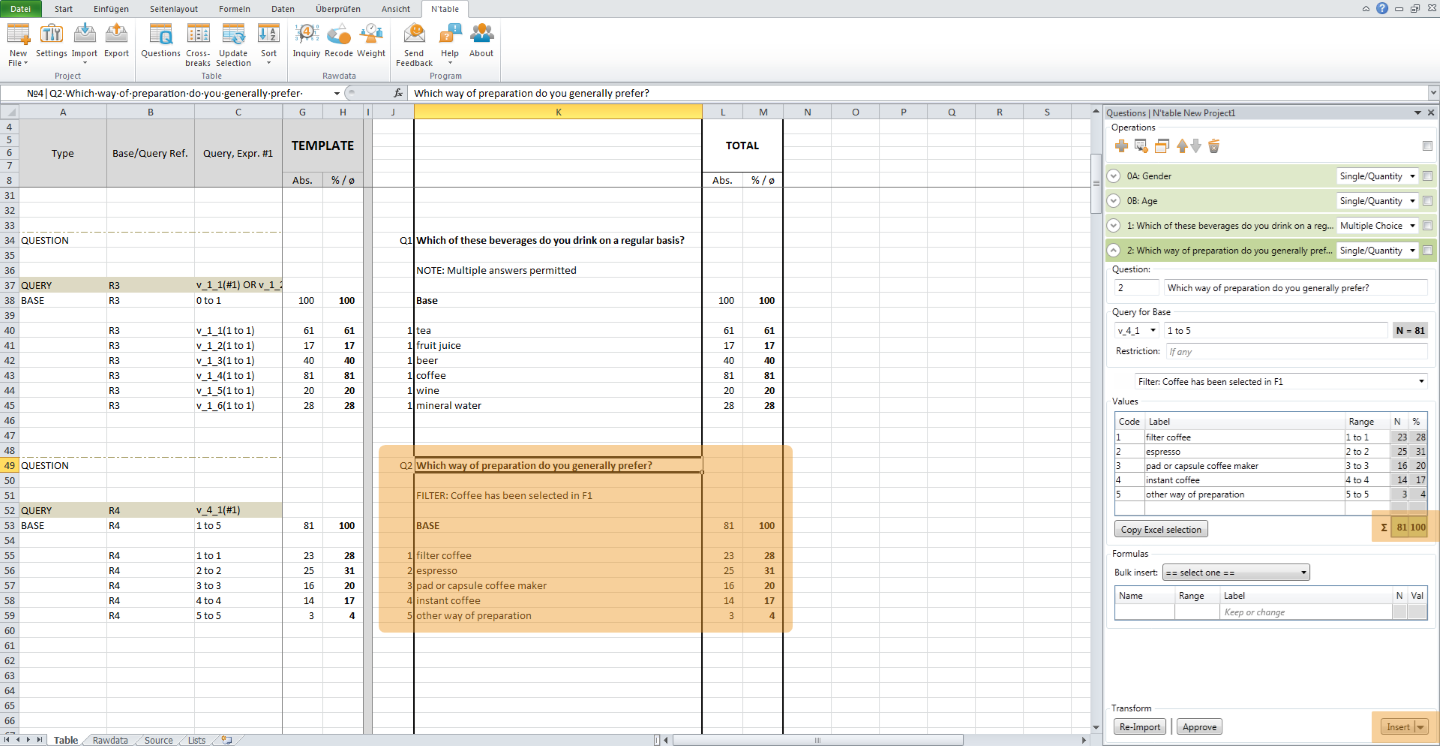
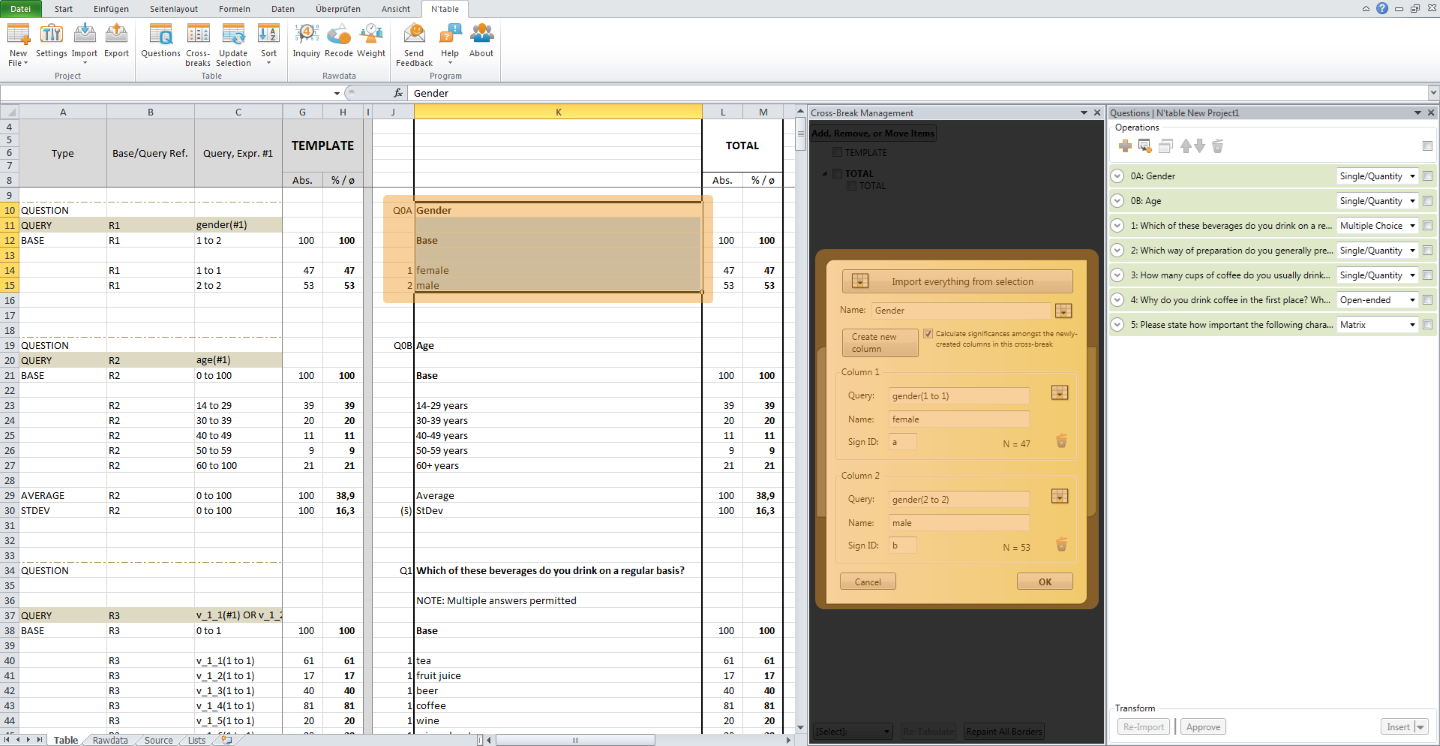
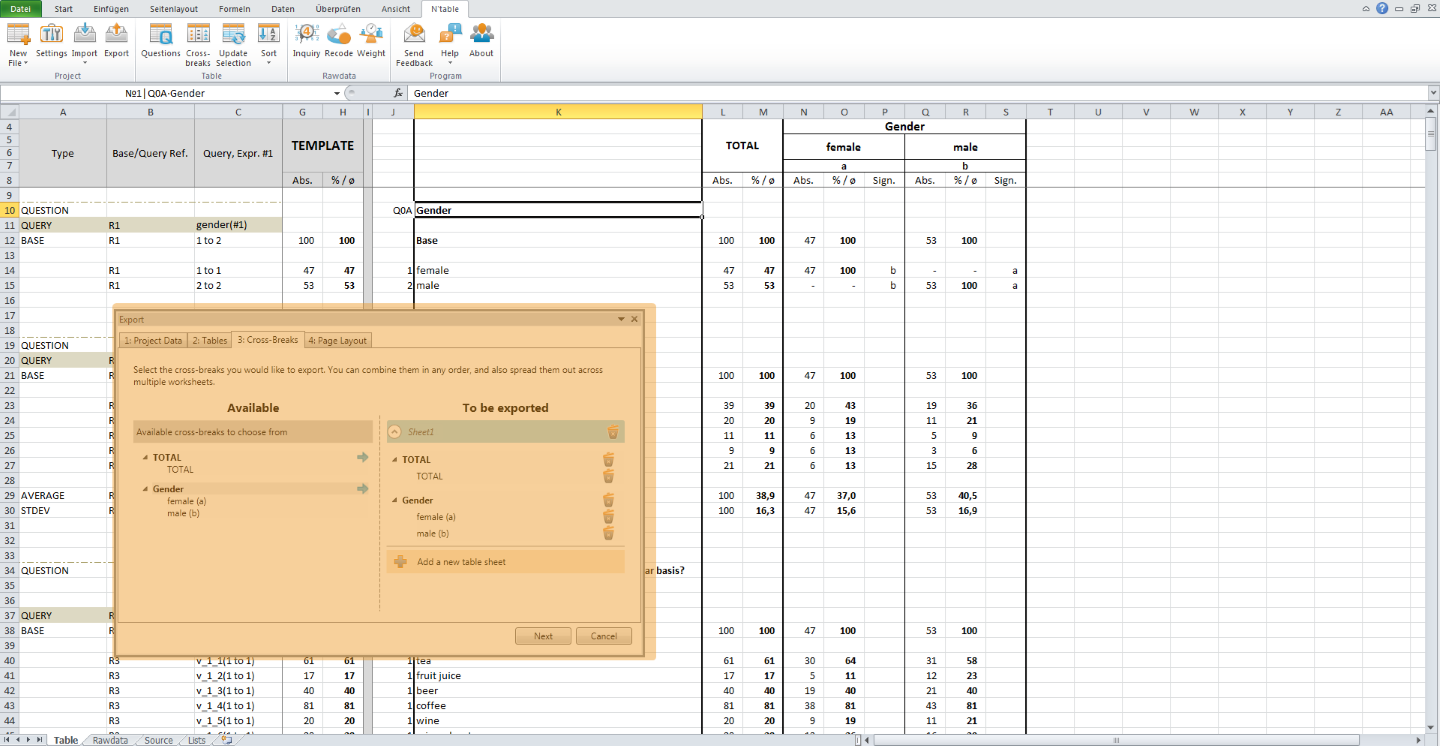
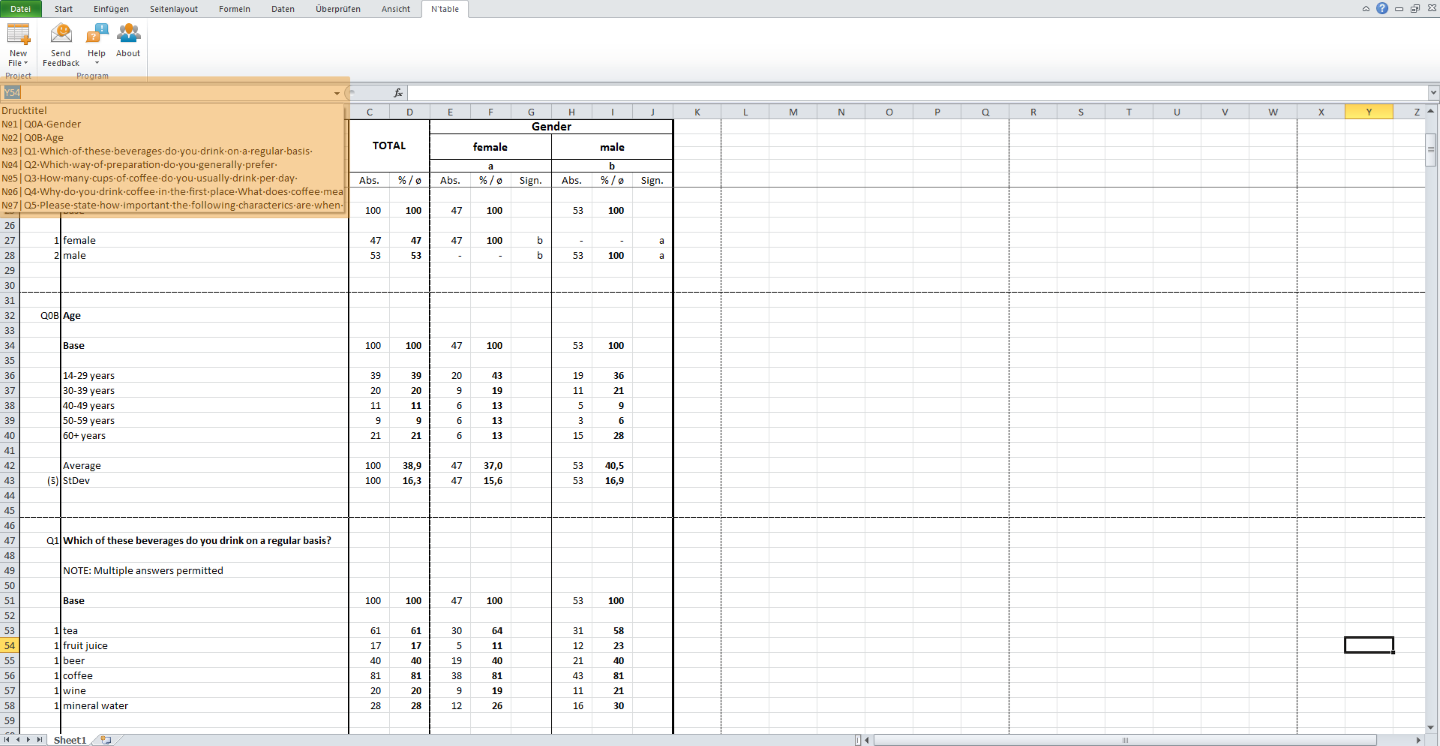
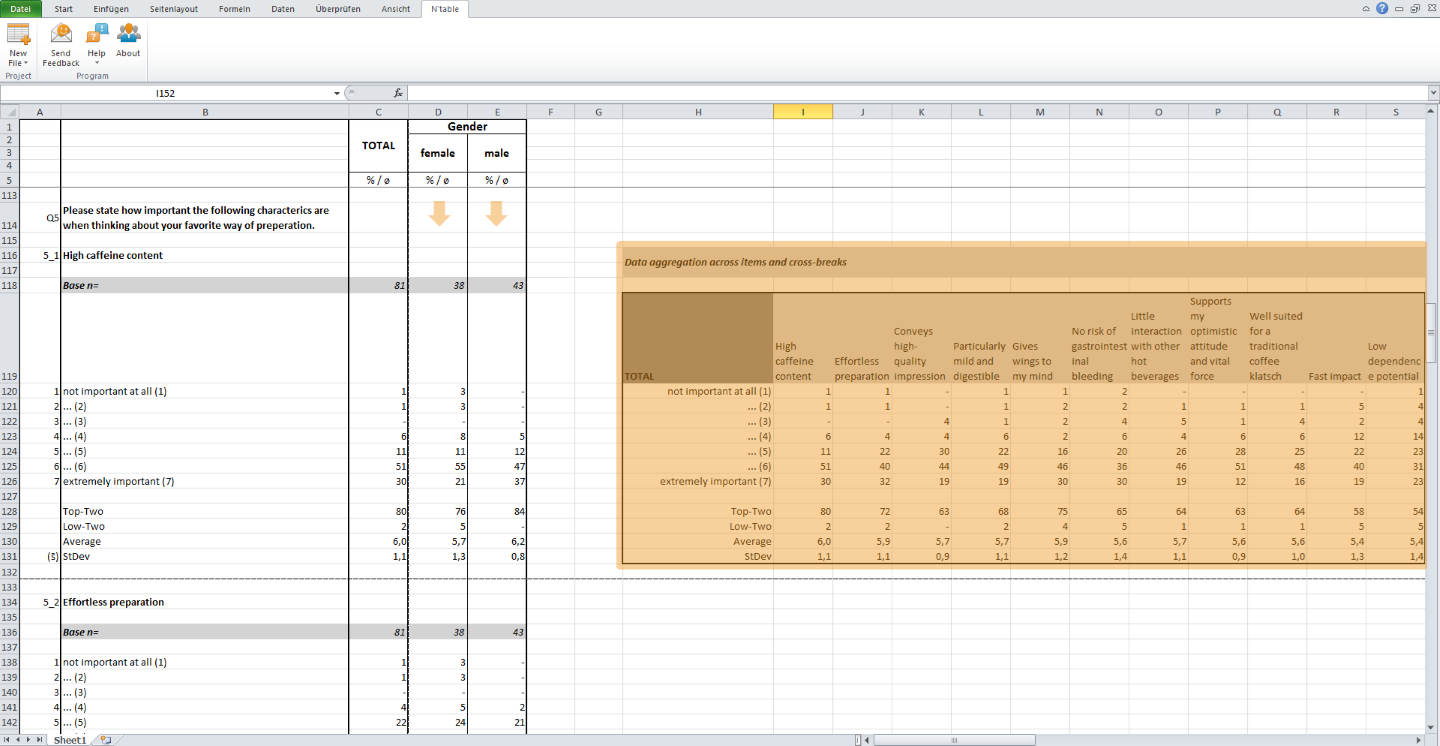
Unique Software
We work exclusively with our own highly specialized tabulation software N’table, which we continuously develop drawing upon our project experience, and the needs and expectations of our clients.

Promptness
Our tables take on average as little as a couple of hours to maximum a day to be completed. If you operate some software independently (e.g. SPSS) or even struggle with Excel formulas, you definitely will not reach a comparable output in the same time.

Reasonable Costs
Professional tabulations are cheaper than you might expect. Our prices start as low as 250 euro for a small set of data. Even for large surveys we arrange our prices affordable for every research agency.